描述
WordPress 图表插件
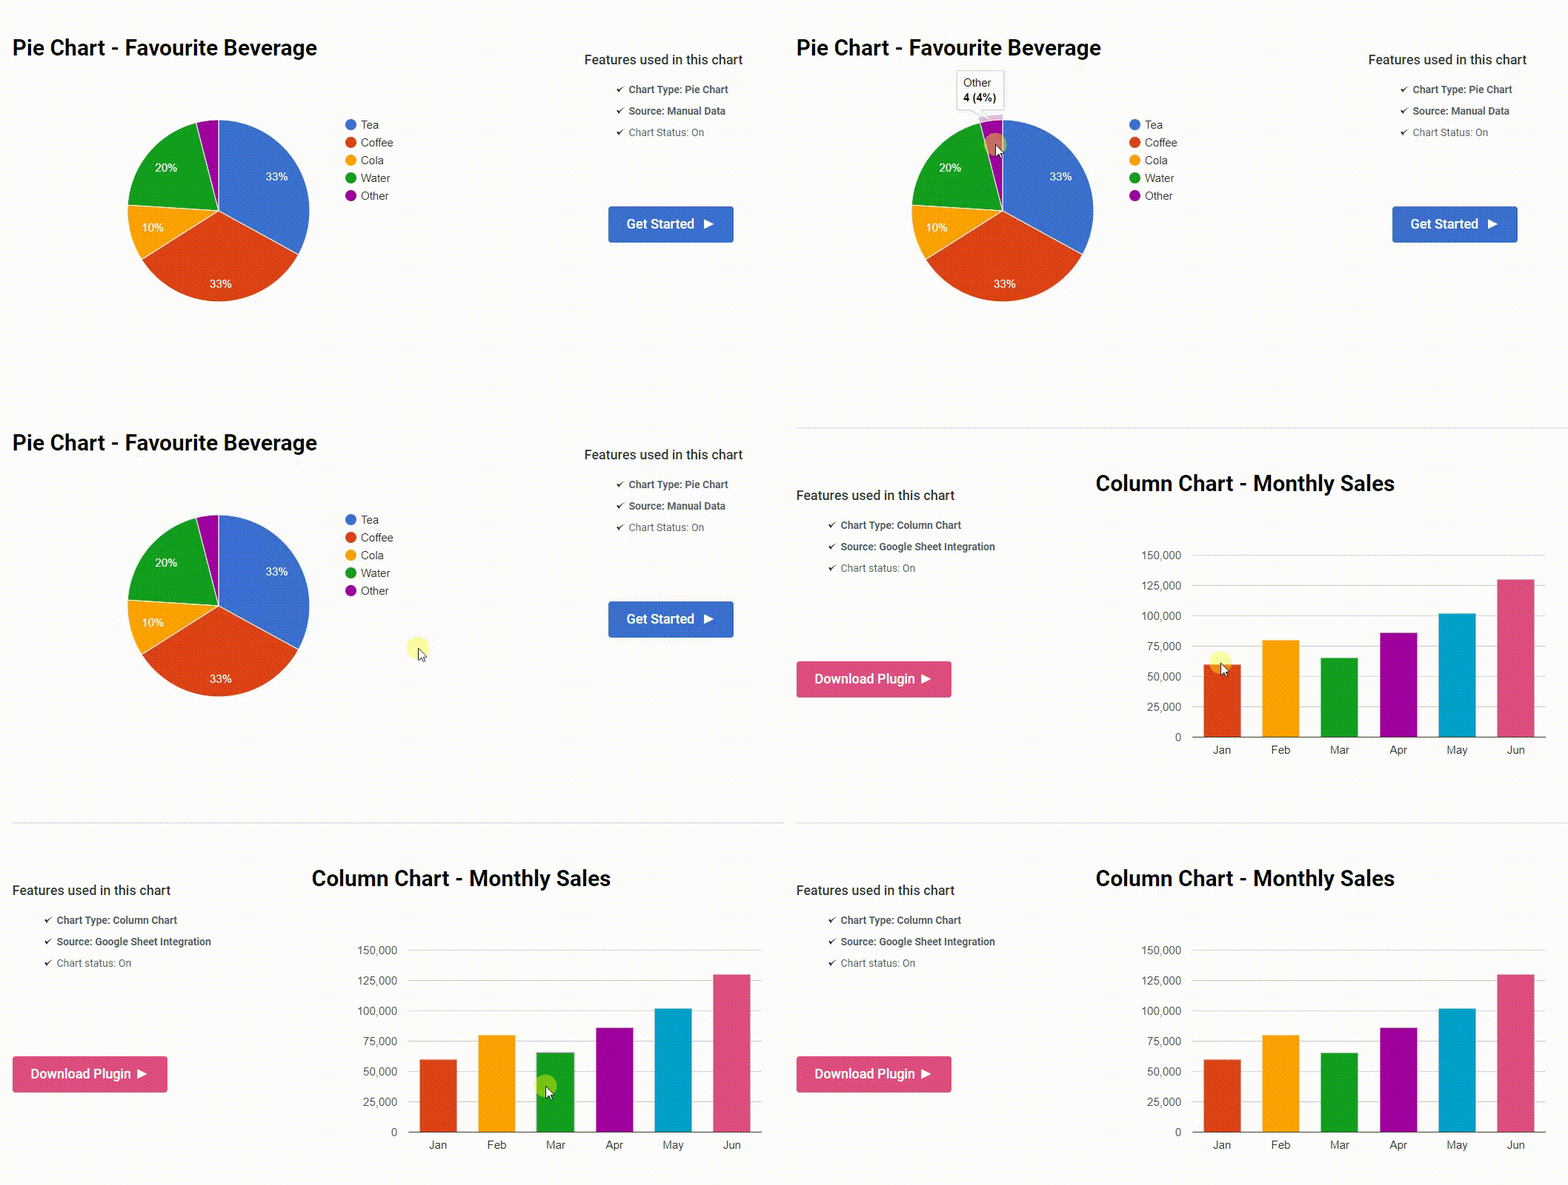
WordPress图表插件 旨在为您的WordPress网站构建静态和动态图表、图形和图表。交互式图表WordPress可以通过三种方法显示:手动输入数据,链接到您的Google电子表格,或查询您喜欢的数据库。
使用WordPress数据可视化插件中包含的各种图表类型创建无限数量的WordPress图表。
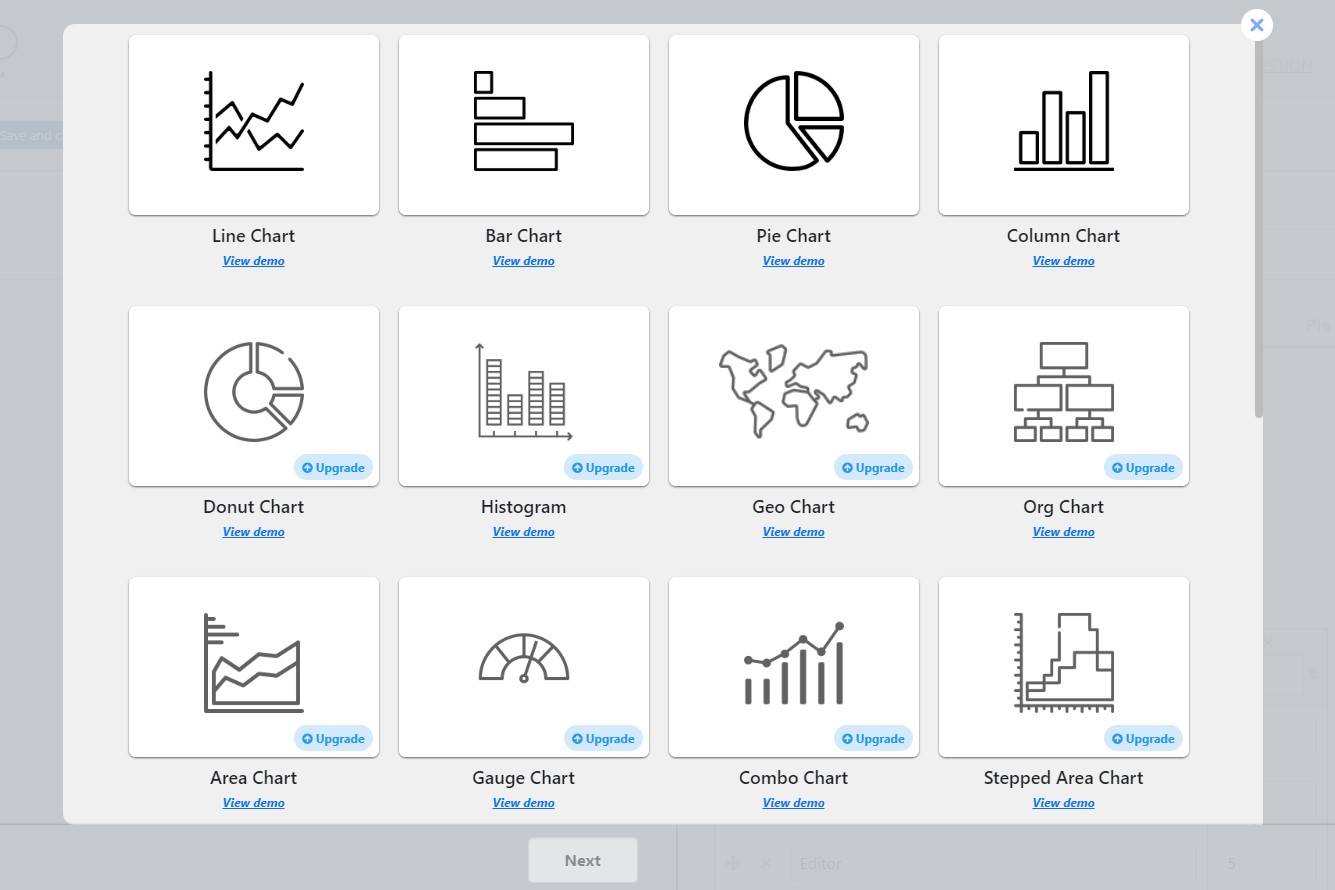
有22种可用的图表类型演示
为什么选择我们而不是其他WordPress图表生成器插件?
使用Chartify,您可以在WordPress帖子和页面中将响应式图表和图表插入其中。创建基于您的数据自动更新的 动态图表。当您将数据添加到您的Google表格中时,插入到您的网站上的图表将自动以excel样式调整。此外,WordPress图表插件允许您通过 实时预览 功能在仪表板上查看图表。在发布之前查看并进行所有必要更改。最重要的是,WordPress图表和图表具有 专业支持 团队,在您使用此可视化器插件的过程中将一直与您同在。如有任何关于插件的问题,请尽管在免费支持论坛上撰写主题。使用WordPress图表插件即可实现所有您的愿望。
易于使用 | 直观设计 | 移动友好
一个 适合初学者 的直观界面使创建图表的过程比以往任何时候都更容易。如果您没有数据可视化背景,完全没有问题 – 使用这款可视化器wordpress工具,您可以像专家一样构建有吸引力的图表和图形。
使用WordPress数据可视化插件创建可视化图表,可以帮助您为受众创建引人入胜的内容。无论您从事什么职业,响应式图表都是您的基本工具。
图表插件是为以下人群设计的:
- 业务所有者可以展示其业务随时间变化的趋势
- 业务分析师
- 数据分析师
- 股票市场人员
- 体育统计网站所有者
- 老师、导师展示他们的学生数据
- 报纸在文章中展示信息图表
- 博客作者、视频博主们展示他们的增长数据
- 科学研究者
- 那些寻求获得商业投资者的人
- 那些想要向董事会成员展示信息的人
- 那些希望通过组织图显示其员工目录的人
- 那些想要从您的测验、投票、调查等中视觉展示见解的人
如何使用
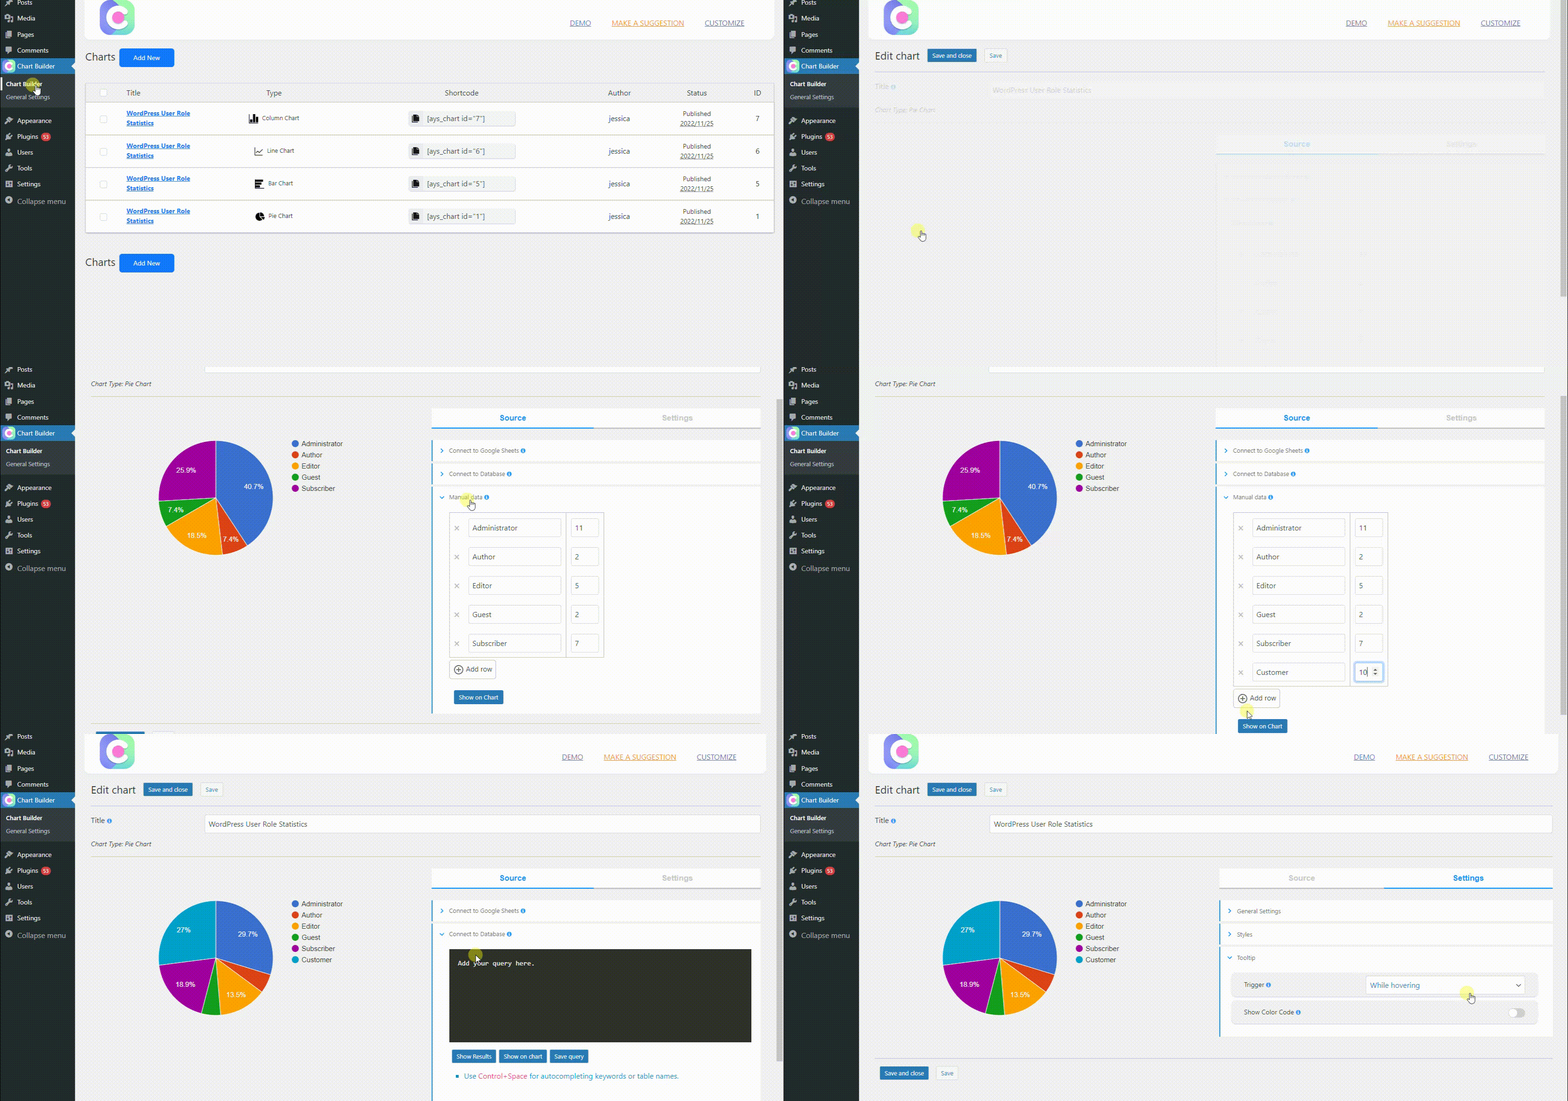
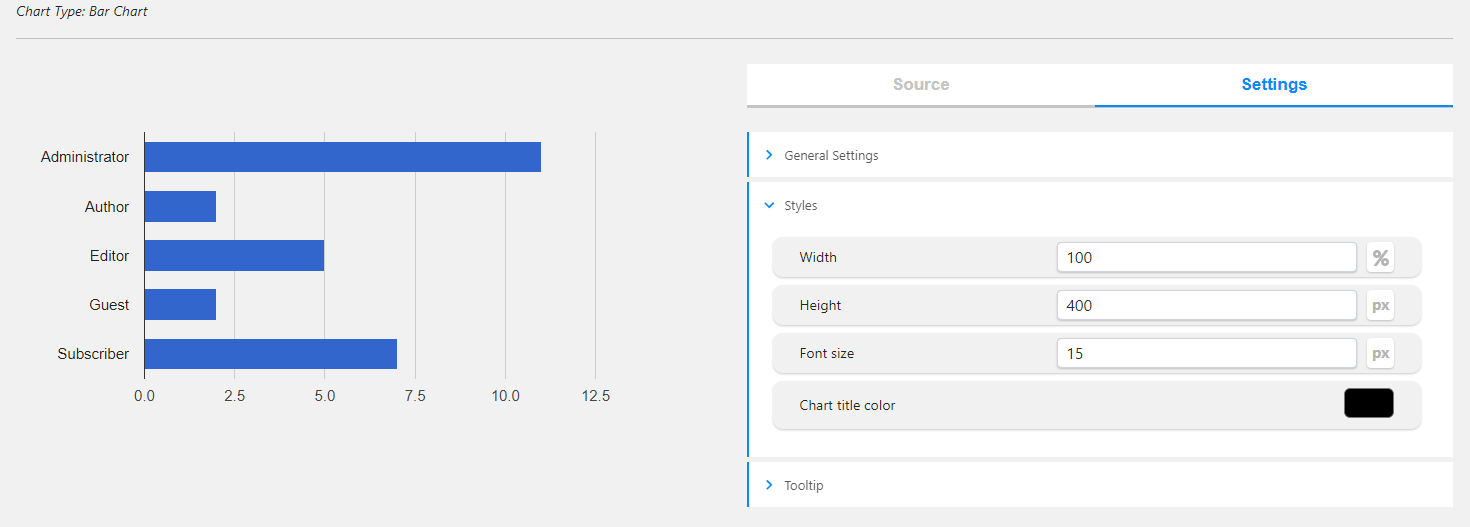
- 通过单击Add New按钮创建图表。
- 选择您喜欢的图表类型。
- 手动添加您的数据。
- 复制生成的短代码并粘贴到您想要的帖子/页面中。
图表短代码
[ays_chart id=”chart_id”]
数据来源
- 手动输入数据
- 谷歌电子表格
- 从数据库查询
手动输入数据构建图表
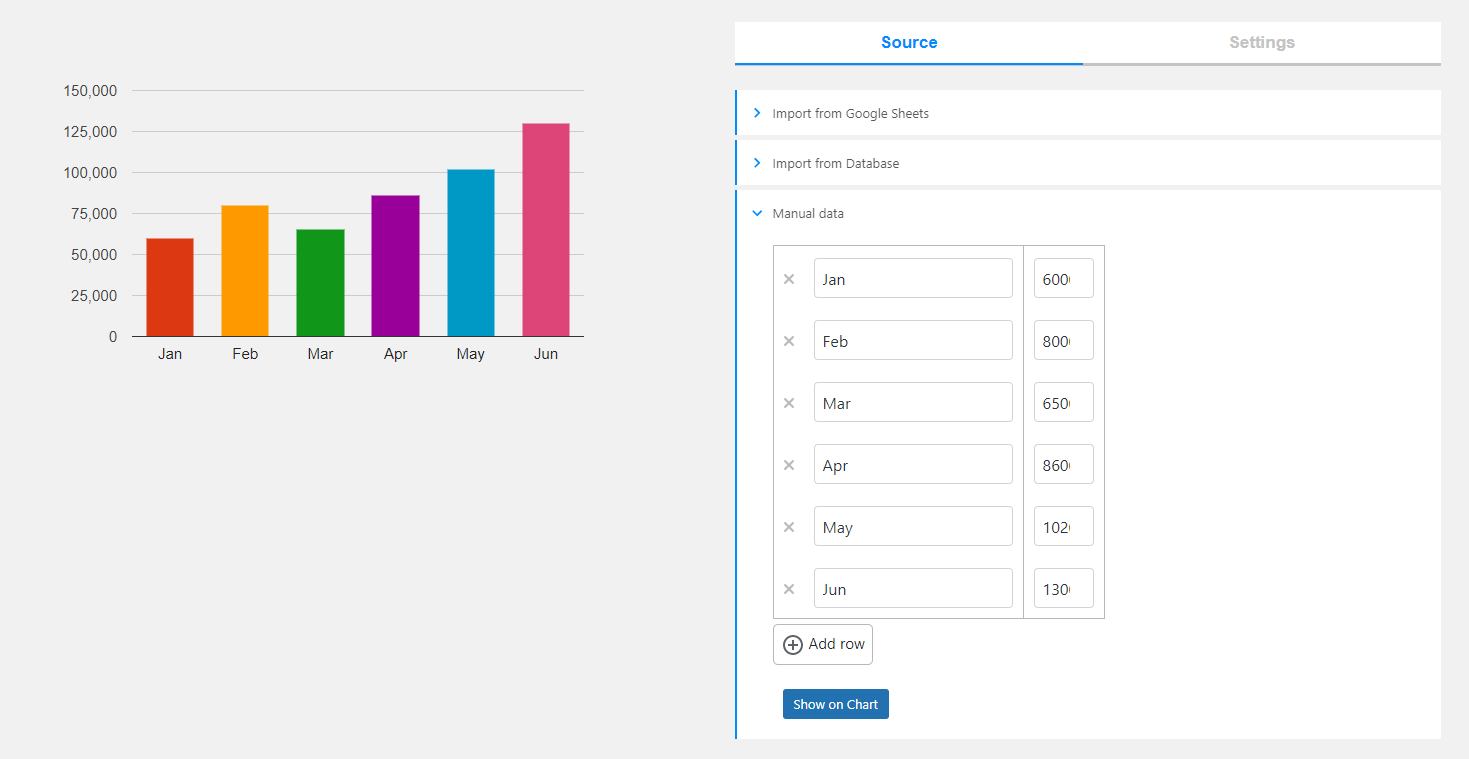
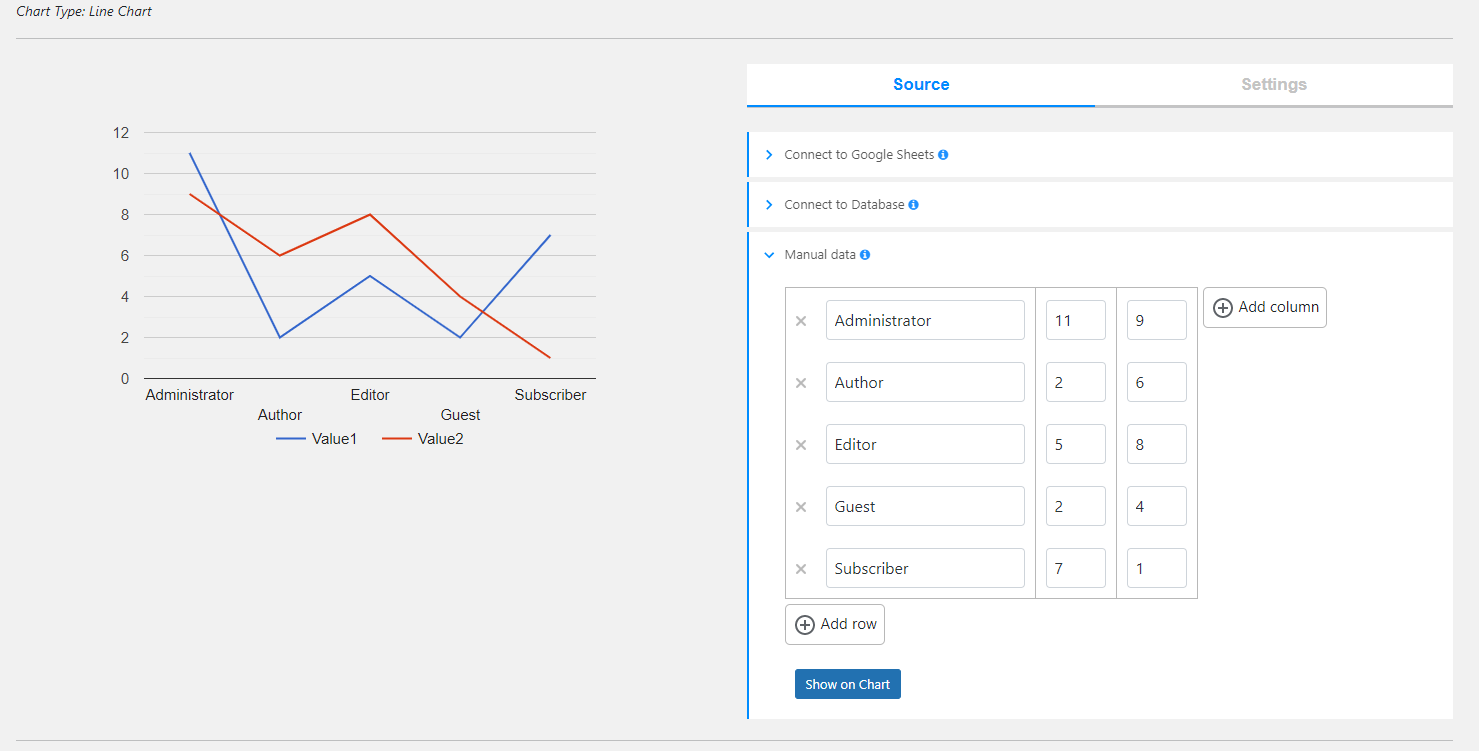
有简单的数据并想提取见解吗?还是想要为WordPress制作图表,并说服或澄清一个观点?使用Chartify可视化插件都不是问题。使用WordPress图表插件可视化数据,您可以通过手动添加所需的数据到您想要的任何图表类型来创建一个图表。
通过 Google 电子表格构建图表
轻松将Chartify连接到您的Google表格,无需任何编程技能。保持通过您的电子表格中的数据为您的图表更新。在几秒钟内像在Excel中那样显示您的数据。最重要的是,您无需配置图表设置来更新图表插件,当您添加或更改任何电子表格中的数据时,它将自动更新。具有视觉数据表示并与我们保存您的数据。是不是很神奇?
通过查询数据库构建图表
使用响应式图表插件快速创建基于查询数据的图表。在这里,您需要具备一些开发技能。这在理想情况下适用于可视化频率分布并显示随时间变化的比较;每天 x 次,每月 x 次等。通过我们的图表制作工具从您的数据创建多彩的图表,并为您的业务制定数据驱动的决策。
使用WordPress图表插件可视化测验数据
如果您正在使用测验制作者插件,您有机会从中制作出交互式图表用于WordPress。可视化数据现在更加容易了。将图表构建插件连接到Quiz Maker,并用各种图表类型显示您测验的数据。使用图形数据表示插件,您可以制作各种图形数据展示多少人回答了测验题目正确或错误,或使用响应式图表插件解释谁在进行您的测验。通过将Quiz Maker插件和Chart WordPress插件结合在一起,您不仅让测验变得更有趣,还在WordPress分析图表中将测验结果变成非常有用的东西。您可以看到趋势,了解人们的做法,并利用这些信息使您的内容变得更好。就像将数字转换为每个人都能理解的数据通过交互式图表WordPress。
可用于 WordPress 数据可视化的图表类型
在 Chart WordPress 插件中以各种图表类型显示数据。通过 WordPress 可视化器,您可以使用流行的类型,并以自己喜欢的方式显示结果。
组织结构图可帮助您在 WordPress 网站上查看团队结构。
有了组织结构图 WordPress 插件,您就可以轻松地将该地图放到您的网站上,让访客了解您的团队是如何一起工作的。
例如,地理图表可以帮助您了解世界各地的情况。它就像一张地图,在 WordPress 图表中显示不同地区的有趣事物。
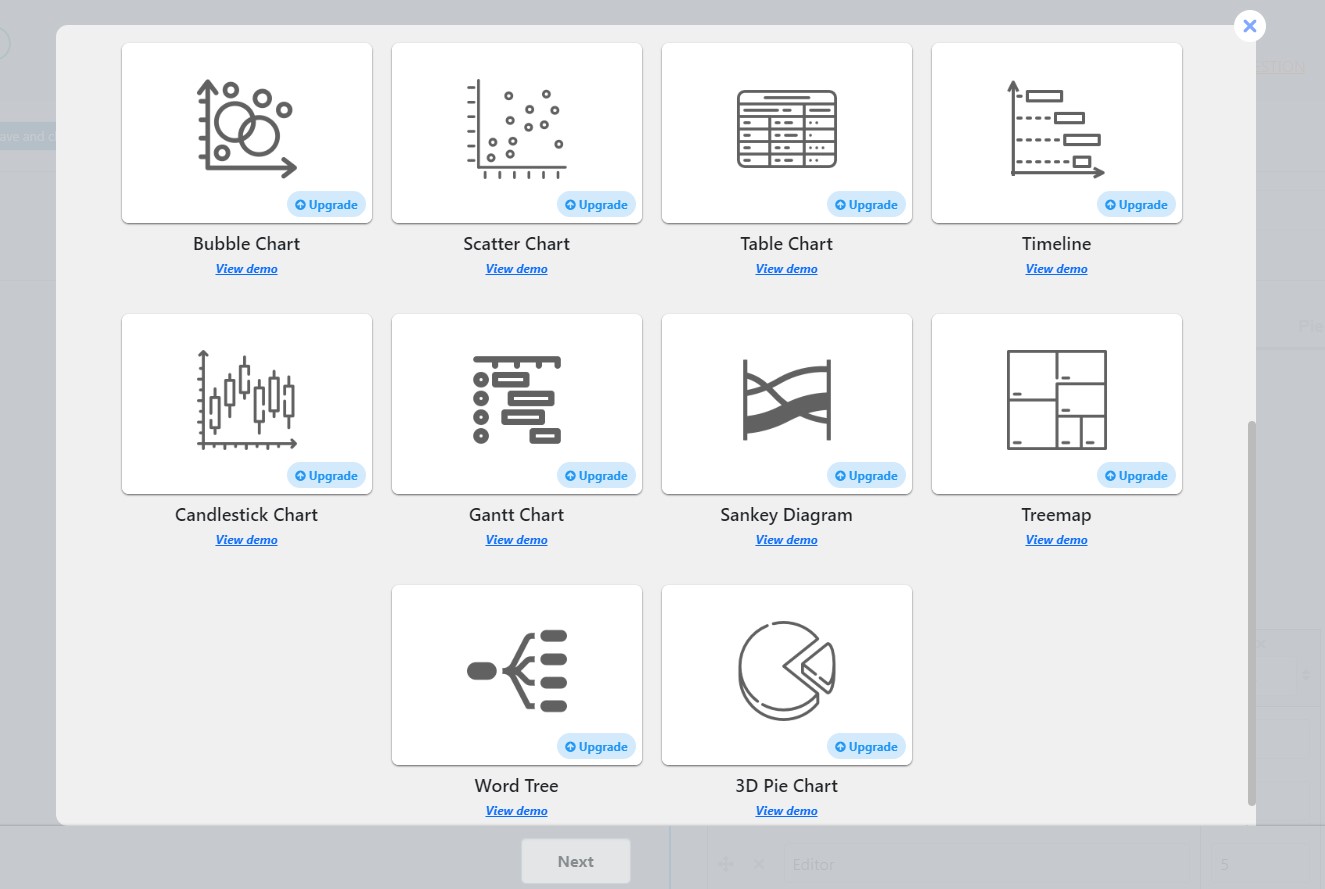
但上述类型只是最佳 WordPress 图表插件为您提供的可能性中的一小部分。请务必亲自试用一下WordPress图表插件,享受WordPress交互式图表中的20多种图表类型。
在Gutenberg编辑器中使用短代码嵌入图表
如果您正在使用Gutenberg编辑器,可以自由地使用短代码嵌入图表。借助用户友好的界面,您的WordPress数据可视化结果将在您的WordPress网站上呈现出色。
特点
- 折线图
- 条形图
- 饼状图
- 柱状图
- 手动数据输入
- 实时预览
- 响应式设计
- 图表权限
高级 功能
- 环形图
- 直方图
- 地理图
- 组织结构图
- 区域图
- 量规图
- 组合图
- 阶梯面积图
- 气泡图
- 散点图
- 表格图
- 时间线
- 烛台图
- 甘特图
- 桑基图
- 树状图
- 词树图
- 3D 饼图
- Google集成
- 数据库录入
第三方或外部服务免责声明
该插件使用Google Charts(https://developers.google.com/chart)。插件中包含的图表是通过Google脚本生成的。
它不会发送任何数据,也不会从请求中收集信息。
隐私政策可在此网址找到:https://developers.google.com/chart/interactive/docs/security_privacy
如有任何进一步问题,请随时通过以下免费支持论坛与我们联系。
屏幕截图
区块
该插件提供了1个区块.
- Chart Builder
安装
Let’s learn how to install the WordPress Chart Builder plugin together. There are two ways to do that.
The first way:
1. Log in to your WordPress website dashboard.
2. Move to the Plugins section on the left navigation menu.
3. Click on the Add New button.
3. Enter Chartify in the search box.
4. Click on Install Now button.
5. Click on the Activate Now button.
The second way:
1. Download the zip file from the Chartify wp.org page via the Download button.
2. Go to the Plugins section on your WordPress website dashboard.
3. Click on the Add New button.
4. Click on the Upload plugin button and upload the file you downloaded beforehand via Choose file button.
5. Click on the Install Now button.
6. Do not forget to activate it.
就是这样。享受这个插件,如果您需要帮助,请随时通过以下免费支持表单联系我们的支持专家。
常见问题
-
1. 我可以向我的图表添加多少数据?
-
无限数据!很惊人,不是吗?您可以添加大量数据到您的图表,无论您使用哪种数据来源。将大数据变成吸引人的图表,并将它们插入您的WordPress网站,使其看起来更吸引人。
-
2. 如何将图表插入帖子或页面?
-
简单易行!让我们一起完成这三个简单的步骤:1.点击添加新内容按钮,选择您喜欢的图表类型。 2. 用您想要的数据源类型(手动,Google表格或数据库)填充数据。 3. 保存并粘贴生成的短代码到您想要的帖子/页面中。您可以从此数据可视化制作工具中获得有意义的见解。
-
3. 我可以手动添加数据吗?
-
手动数据是图表插件提供的可用数据源之一。您只需转到您网站的控制面板,然后从左侧导航栏单击Chartify插件,创建一个新的图表,并手动填写数据。您可以添加任意数量的行和列。您可以在发布之前实时预览您的图表。利用wp图表插件中提供的高级功能构建最佳图表。
-
4. 图表插件是否适用于任何主题?
-
根据我们的测试结果 – 是。Chart Maker插件与我们遇到的所有主题兼容。如果遇到任何问题,请不要犹豫,通过支持论坛联系我们的支持专家。AYS Pro为您开发了一个工具,可以轻松地进行动态数据可视化。
-
5. 升级到专业版本后,我的数据会丢失吗?
-
绝对不。您的数据与我们一起安全可靠。此外,请注意,您的数据仅保存在您的数据库中,我们无法访问。所以,为了不丢失数据,您需要正确地升级插件。要做到这一点,请按照这篇文章中的步骤进行操作。一定要选择适合WordPress的最佳图表插件,因为您值得拥有。
-
6. 是否有文档或用户指南?
-
当然可以!查看图表插件文档,了解插件提供的可用功能,并阅读其提供的功能。
-
7. 我有问题或建议,我该如何联系您?
-
如果您对免费版本有建议或问题,请毋需犹豫,写下一个帖子前往免费支持论坛。我们的支持专家将在工作日内12小时内回答您。如果您有售前问题,并希望决定是否购买,请随时通过以下联系我们表格联系我们的销售专家。
评价
贡献者及开发者
更新日志
2.3.6
- Fixed: Chart display issues on the front page
2.3.5
- Added: Donut chart type
2.3.4
- Improved: Styles on the admin dashboard
2.3.3
- Added: Organization chart description font size option
2.3.2
- Fixed: Issue with decimal numbers not saving in the manual source type
2.3.1
- Added: Organization chart description color option
- Tested: Compatible up to 6.5
2.3.0
- Fixed: Style issues on the admin dashboard
2.2.9
- Added: Organization chart text font size option
2.2.8
- Added: Organization chart text color option
- Fixed: Series color option issue
2.2.7
- Added: Organization chart border radius option
2.2.6
- Added: Organization chart padding option
- Fixed: Chart border radius option issue
2.2.5
- Added: Organization chart Custom CSS class option
- Added: Organization chart Background color option
2.2.4
- Added: Organization chart allow collapse option
2.2.3
- Added: Organization chart element size option
2.2.2
- Added: Organization chart type
2.2.1
- Fixed: Issue with Elementor plugin
- Added: Italian language support
- Added: Spanish language support
- Added: French language support
- Added: Dutch language support
- Added: Portuguese language support
- Added: Russian language support
2.2.0
- Fixed: Styles on the admin dashboard
2.1.9
- Added: Horizontal axis Label interval option
2.1.8
- Added: Enable row settings option in the row settings tab
- Fixed: Sanitizing issues on the admin dashboard
2.1.7
- Added: Axes baseline color option
2.1.6
- Added: Single bar opacity option in the row settings tab
2.1.5
- Added: Styles tab on the admin dashboard
2.1.4
- Added: Transparent background option
- Improved: Styles on the admin dashboard
2.1.3
- Added: Information popup about the form after creating a form
- Improved: Styles on the admin dashboard
2.1.2
- Added: Bar, column chart row settings tab
- Added: Bar, column chart single bar color option
- Fixed: Chart display issue on the front end
2.1.1
- Added: Chart border radius option
2.1.0
- Fixed: Banner countdown issue
2.0.9
- Improved: Live chart functionality on the admin dashboard
2.0.8
- Improved: Styles on the admin dashboard
2.0.7
- Improved: Styles on the admin dashboard
2.0.6
- Added: Chart position option
2.0.5
- Added: Axes minor gridlines color option
2.0.4
- Added: Axes gridlines color option
2.0.3
- Added: Axes label italic and bold options
2.0.2
- Added: Axes text italic and bold options
2.0.1
- Added: Line chart autofill nulls option
2.0.0
- Added: Duplicate action for charts
1.9.9
- Added: Chart title italic option
- Added: Chart description italic option
1.9.8
- Added: Chart title bold option
- Added: Chart description bold option
1.9.7
- Fixed: Style issues on the front end
- Fixed: Security issues on the admin dashboard
- Tested: Compatible up to 6.4.1
1.9.6
- Improved: Styles on the admin dashboard
1.9.5
- Added: Axes label font color option
- Added: Axes text font size option
1.9.4
- Added: Legend text italic and bold options
- Added: Tooltip text bold option
1.9.3
- Added: Tooltip text italic option
1.9.2
- Added: Legend font size option
1.9.1
- Added: Tooltip font size option
- Tested: Compatible up to 6.4
1.9.0
- Added: Chart description position option
1.8.9
- Added: Line chart crosshair opacity option
- Improved: Styles on the admin dashboard
1.8.8
- Added: Line chart crosshair orientation option
1.8.7
- Added: Line chart crosshair trigger option
1.8.6
- Fixed: Some issues on the admin dashboard
1.8.5
- Improved: Styles on the Add New page
- Tested: Compatible up to 6.3.2
1.8.4
- Added: Functionality to change chart types directly from the edit page
1.8.3
- Improved: Styles on the admin dashboard
1.8.2
- Added: Status column in the charts list table
- Added: Date column in the charts list table
1.8.1
- Improved: Styles on the admin dashboard
1.8.0
- Added: Publish/unpublish action for charts
1.7.9
- Fixed: JS Issues in Our products page
1.7.8
- Added: Ability to set chart width and height in percentage or pixels
- Improved: Bars width option
1.7.7
- Fixed: Styles on the admin dashboard
- Updated: POT file
1.7.6
- Added: Manual data navigation with Enter key
- Updated: POT file
1.7.5
- Added: Chart area margin options
- Fixed: Banner security issue on the admin dashboard
1.7.4
- Added: Chart responsive width option
- Tested: Compatible up to 6.3.1
1.7.3
- Added: Chart border color option
- Added: Chart area border color option
1.7.2
- Added: Chart border width option
- Added: Chart area border width option
1.7.1
- Added: Chart background color option
- Added: Chart area background color option
1.7.0
- Tested: Compatible up to 6.3
- Improved: Dashboard styles
1.6.9
- Added: Axes gridlines count option
1.6.8
- Added: Chart title gap option
- Updated: POT file
1.6.7
- Improved: Dashboard styles
1.6.6
- Added: Axes min/max value options
1.6.5
- Added: Axes label font size option
1.6.4
- Added: Show chart description option
- Fixed: Styles on the admin dashboard
- Fixed: PHP issues on the admin dashboard
1.6.3
- Improved: Deactivate popup style on the plugins page
- Improved: Filters section on the all charts page
1.6.2
- Changed: Styles on the admin dashboard
- Fixed: Bar width option issues
1.6.1
- Added: Maximized view option
1.6.0
- Added: Axes format option
- Fixed: Styles on the admin dashboard
1.5.9
- Added: Manual data ordering by columns functionality
1.5.8
- Added: Manual data ordering functionality
1.5.7
- Changed: Styles on the admin dashboard
1.5.6
- Changed: Styles on the admin dashboard
1.5.5
- Added: Line chart orientation option
1.5.4
- Added: Enable chart interactivity option
1.5.3
- Fixed: Styles on the admin dashboard
1.5.2
- Added: Bar, column charts bar width option
1.5.1
- Added: Pie chart slices text color option
- Updated: POT file
1.5.0
- Added: Pie chart slices offset option
- Added: Bar, column, line chart series visible in legend option
1.4.9
- Added: Pie chart slices settings tab
- Added: Bar, column, line chart series settings tab
- Added: Pie chart slices color option
- Added: Bar, column, line chart series color option
- Changed: CSS Styles on the admin dashboard
1.4.8
- Added: Line chart point size option
1.4.7
- Added: Line chart point shape option
- Tested: Compatible up to 6.2.2
1.4.6
- Added: Line chart multiple data format option
1.4.5
- Added: Line chart multiple data selection option
- Tested: Compatible up to 6.2.1
1.4.4
- Added: Pie chart data grouping label option
- Added: Pie chart data grouping color option
1.4.3
- Added: Pie chart data grouping limit option
1.4.2
- Added: Chart animation startup option
- Added: Chart animation easing option
1.4.1
- Added: Chart animation functionality
- Added: Chart animation duration option
1.4.0
- Added: Chart title position option
- Fixed: Style issues on the front page
1.3.9
- Added: Line chart line width option
1.3.8
- Added: Filter by author functionality on the charts page
- Fixed: Style issues on the admin dashboard
1.3.7
- Added: Filter by chart type functionality on the charts page
- Fixed: Style issues on the admin dashboard
1.3.6
- Added: Search by title functionality on the charts page
- Improved: Legend position option
- Fixed: Style issues on the admin dashboard
1.3.5
- Added: Settings live preview functionality
- Added: Tooltip text color option
1.3.4
- Added: Horizontal axis slanted text option
- Added: Horizontal axis slanted text angle option
- Tested: Compatible up to 6.2
1.3.3
- Added: Horizontal axis text color option
- Added: Vertical axis text color option
1.3.2
- Added: Horizontal axis direction option
- Added: Vertical axis direction option
1.3.1
- Added: Horizontal axis text position option
- Added: Vertical axis text position option
1.3.0
- Added: Horizontal axis title option
- Added: Vertical axis title option
- Changed: CSS Styles on the admin dashboard
1.2.9
- Added: Show chart title option
1.2.8
- Added: Opacity option for line, bar, column types
- Fixed: CSS Styles on admin dashboard
1.2.7
- Added: Change the author of the current chart option
- Changed: CSS Styles on admin dashboard
1.2.6
- Added: Chart type settings tab on admin dashboard
- Changed: CSS Styles on admin dashboard
1.2.5
- Added: Pie chart slice text option
1.2.4
- Added: Pie chart tooltip text option
- Changed: CSS Styles on admin dashboard
1.2.3
- Added: Pie chart reverse categories option
- Fixed: CSS Styles on admin dashboard
- Fixed: PHP issue on admin dashboard
1.2.2
- Fixed: CSS Styles on admin dashboard
- Updated: POT file
1.2.1
- Added: Legend Font Color option
- Fixed: JS issues on admin dashboard
1.2.0
- Added: Chart description font color option
- Added: Chart description font size option
1.1.9
- Added: Delete column functionality
- Added: Chart title font size option
- Fixed: CSS Styles on admin dashboard
1.1.8
- Added: Integration with Quiz Maker plugin
1.1.7
- Added: Line chart type
1.1.6
- Added: Bar and Column charts is stacked option
- Changed: CSS Styles on admin dashboard
1.1.5
- Added: Bar and Column chart focus target option
- Added: Confirmation for delete actions
1.1.4
- Added: Pie Chart slice border color option
1.1.3
- Added: Pie chart rotation degree option
- Fixed: JS issue on admin dashboard
1.1.2
- Added: Shortcode text for editor for chart
- Fixed: Tooltip display issues on admin dashboard
1.1.1
- Added: Titles for chart data
- Fixed: CSS Styles on admin dashboard
1.1.0
- Added: Bulk delete action
1.0.9
- Added: Legend alignment option
1.0.8
- Added: Except words count in list table option
- Fixed: CSS styles on admin dashboard
1.0.7
- Added: Add column option for Column and Bar chart types
- Changed: CSS Styles on admin page
1.0.6
- Added: Elementor widget
- Fixed: CSS styles on admin and front pages
1.0.5
- Added: Gutenberg editor widget
- Added: How to use page
1.0.4
- Changed: CSS Styles on admin page
1.0.3
- Added: Legend position option
- Fixed: CSS Style issues on admin dashboard
1.0.2
- Added: Chart Description option
1.0.1
- Fixed: CSS Style issue on admin page
1.0.0
- Relaesed
