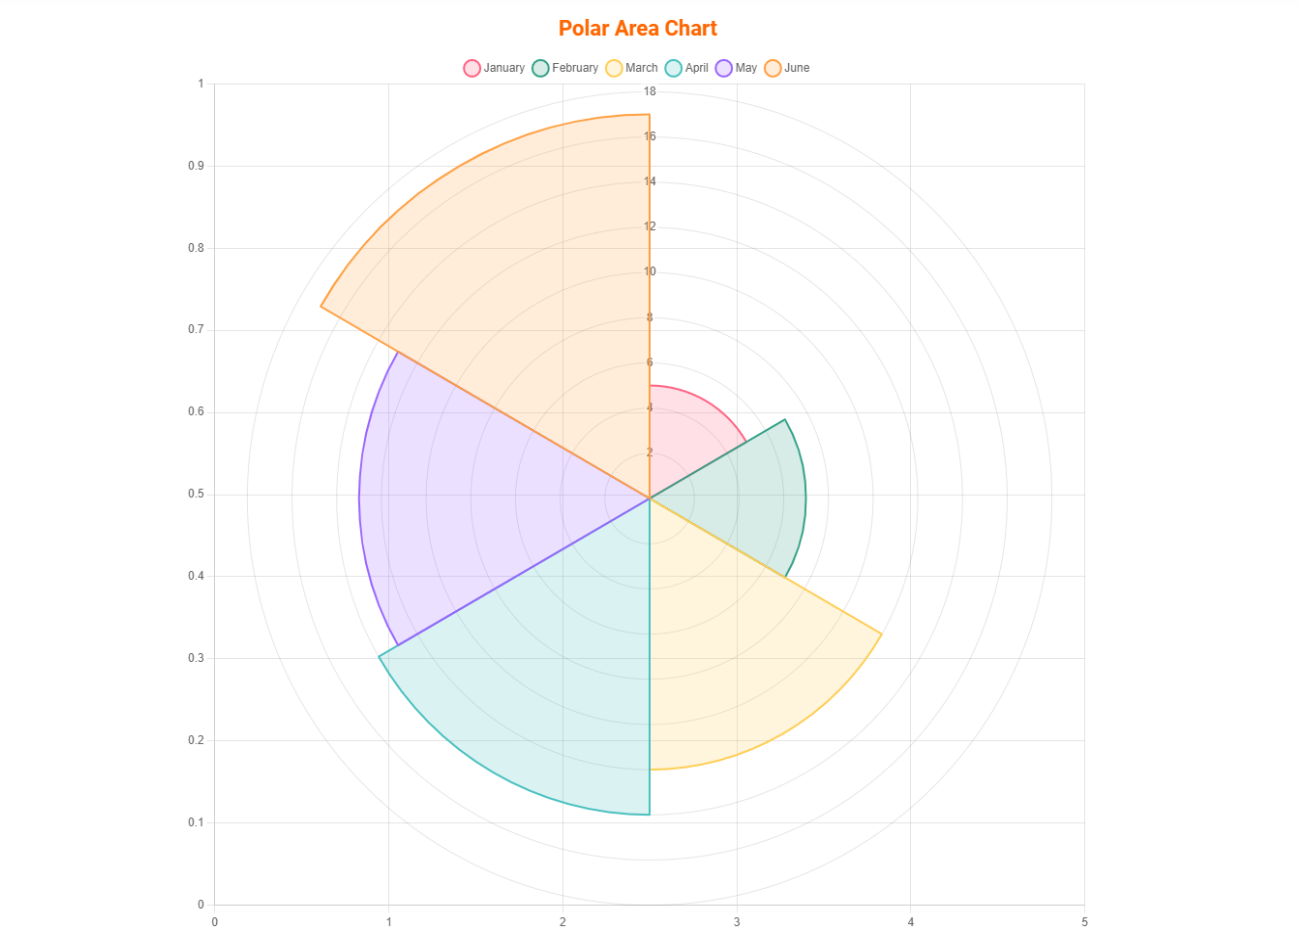
描述
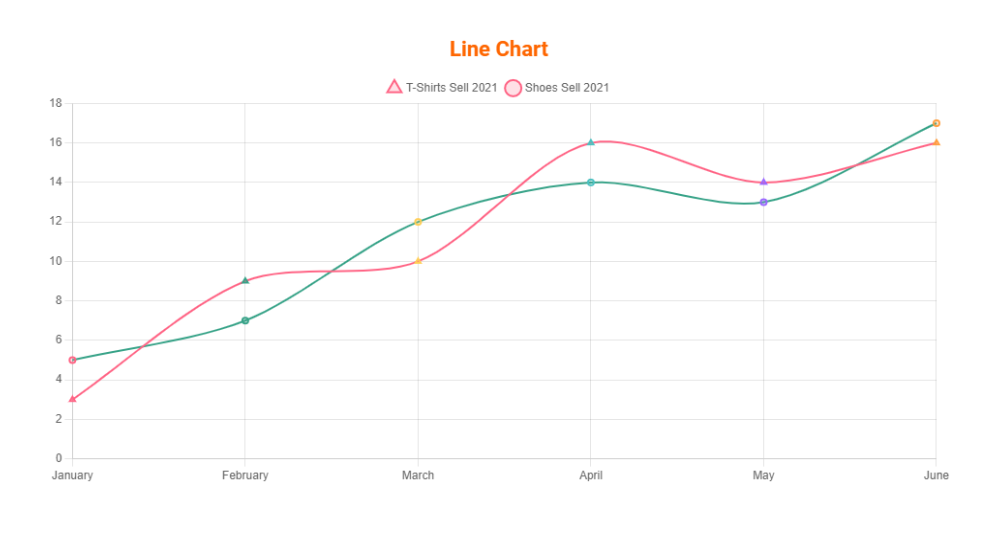
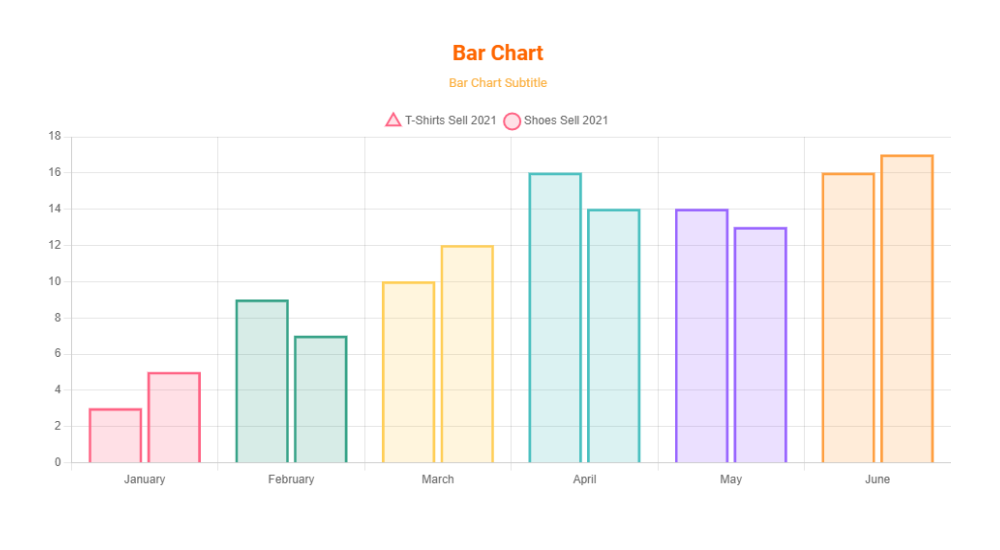
This plugin can represent tabular numeric data, functions or some kinds of quality structure and provides different info.
Features
- Fully Customizable: All the options you need to arrange the showcase to your liking are available here.
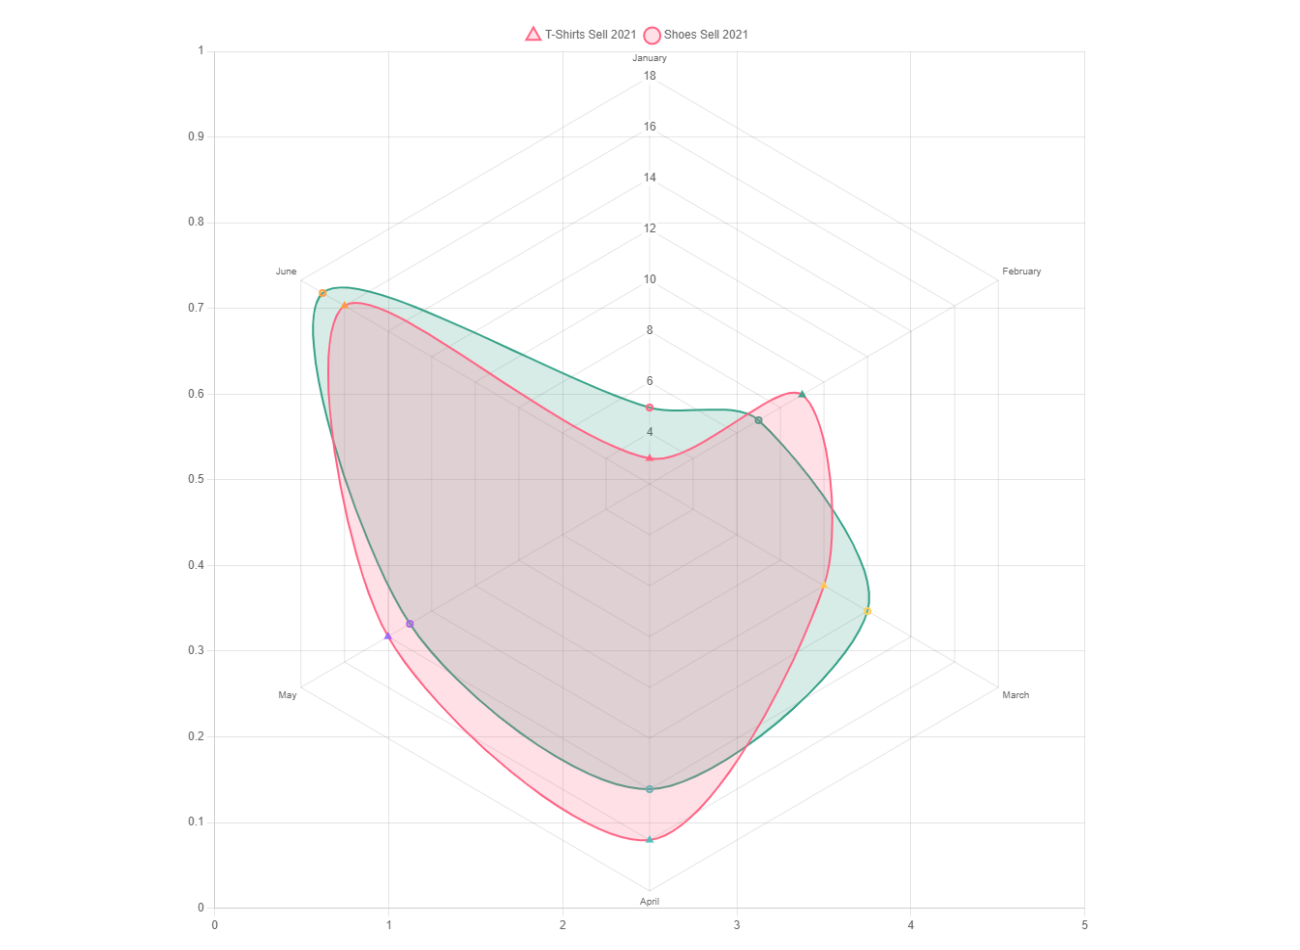
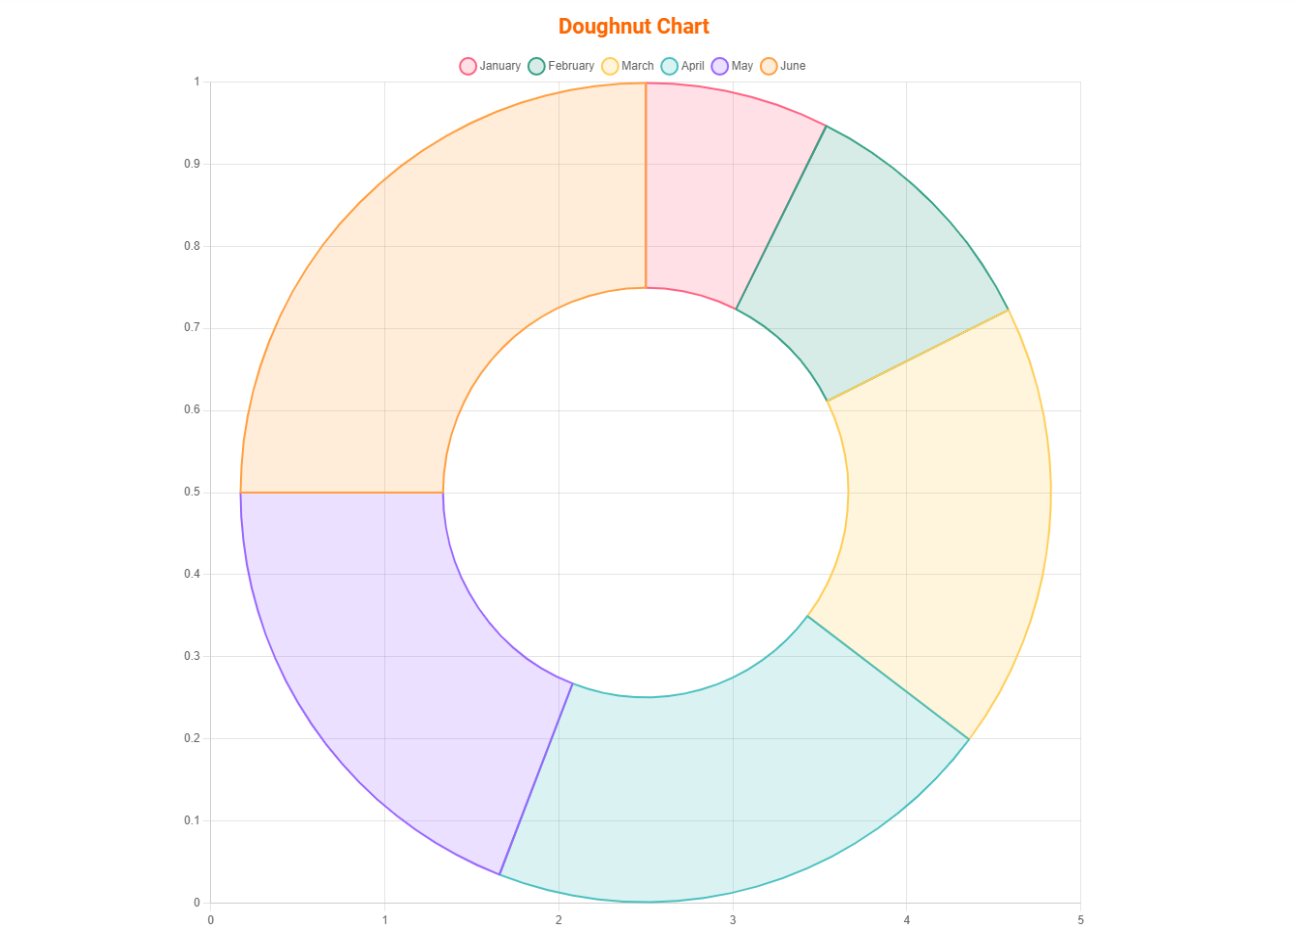
- Different Types: Chart block comes with different types, you can easily switch the type of chart.
How to use
- First, install the Chart Block plugin
- Add the Chart Block from the block category called “Widgets” in the Gutenberg editor.
- You can change block settings from the right-side settings sidebar.
-
Enjoy!
-
For Installation help click on Installation Tab
Feedback
- Did you like this plugin? Dislike it? Do you have a feature request?equest? Please share your feedback with us
⭐ Check out the Parent Plugin of this plugin-
🔥 b Blocks – Best gutenberg blocks collections for WordPress.
⭐ Check out our other WordPress Plugins-
🔥 Html5 Audio Player – Play .mp3, .wav, and .ogg audio files in WordPress.
🔥 Html5 Video Player – Best video player plugin for WordPress.
🔥 PDF Poster – A fully-featured PDF Viewer Plugin for WordPress.
🔥 Document Embedder – Embed Word, Excel, PowerPoint, Apple Pages, Psd, Pdf and more.
🔥 3D Viewer – Display interactive 3D models on the webs.
🔥 Advanced Post Block – Display your Posts, Custom Post Content and Blogs in a professional way!
屏幕截图
区块
该插件提供了1个区块.
- Chart Graphical representation for data visualization.
安装
From Gutenberg Editor:
- Go to the WordPress Block/Gutenberg Editor
- Search For Chart Block
- Click on the Chart Block to add the block
Download & Upload:
- Download the Chart Block plugin (.zip file)
- In your admin area, go to the Plugins menu and click on Add New
- Click on Upload Plugin and choose the
chart-block.zipfile and click on Install Now - Activate the plugin and Enjoy!
Manually:
- Download and upload the Chart Block plugin to the
/wp-content/plugins/directory - Activate the plugin through the Plugins menu in WordPress
常见问题
-
Is Chart Block free?
-
Yes, Chart Block is a free Gutenberg block plugin.
-
Does it work with any WordPress theme?
-
Yes, it will work with any standard WordPress theme.
-
Can I change block settings?
-
Yes, you can change block settings from the Gutenberg block editor’s right sidebar.
-
How many times can I reuse a block?
-
You can use unlimited times as you want.
-
Where can I get support?
-
You can post your questions on the support forum here
评价
贡献者及开发者
“Chart Block – Represent your data by chart” 是开源软件。 以下人员对此插件做出了贡献。
贡献者更新日志
1.1.6
- Fix Border Issue
1.1.5
- Performance Improvement
1.1.4
- Add translate feature
1.1.3
- Reduce PHP Code
- Performance Improvement
1.1.2
- Add option for height
1.1.1
- Reduce PHP Code
1.1.0
- Add option for show hide X or Y scales
1.0.5
- Add option for showing hide grid lines
1.0.4
- Add the download option for the chart
1.0.3
- Performance upgrade
1.0.2
- Update theme and Colors
1.0.1
- Add an option to change the point size
- Fix border size when hovering
1.0.0
- Initial Release
